Getting started
Follow these steps to get your mapping environment running from scratch.
Create a Virtual Environment
It is highly recommended to use a virtual environment to avoid version conflicts between PyQt6 and other Qt-based tools.
# Create the environment
python -m venv .venv

# Activate it
# On Windows:
.venv/Scripts/activate
# On Mac/Linux:
source .venv/bin/activate
Install PyQtGraph-GIS
Implementation
Create a python file for your script.
For this guide we will use OpenStreetMap as our tile provider.
Important
When using OpenStreetMap as the tile provider it is very important to include a custom User-Agent and an attribution text, as per their Usage Policy.
from pyqtgraph_gis import MapWidget
from PyQt6 import QtWidgets
if __name__ == "__main__":
app = QtWidgets.QApplication([])
w = QtWidgets.QWidget()
# Required for OSM Tile Server compliance
headers = {
"User-Agent": "MyMapApp/1.0 (contact: email@example.com)"
}
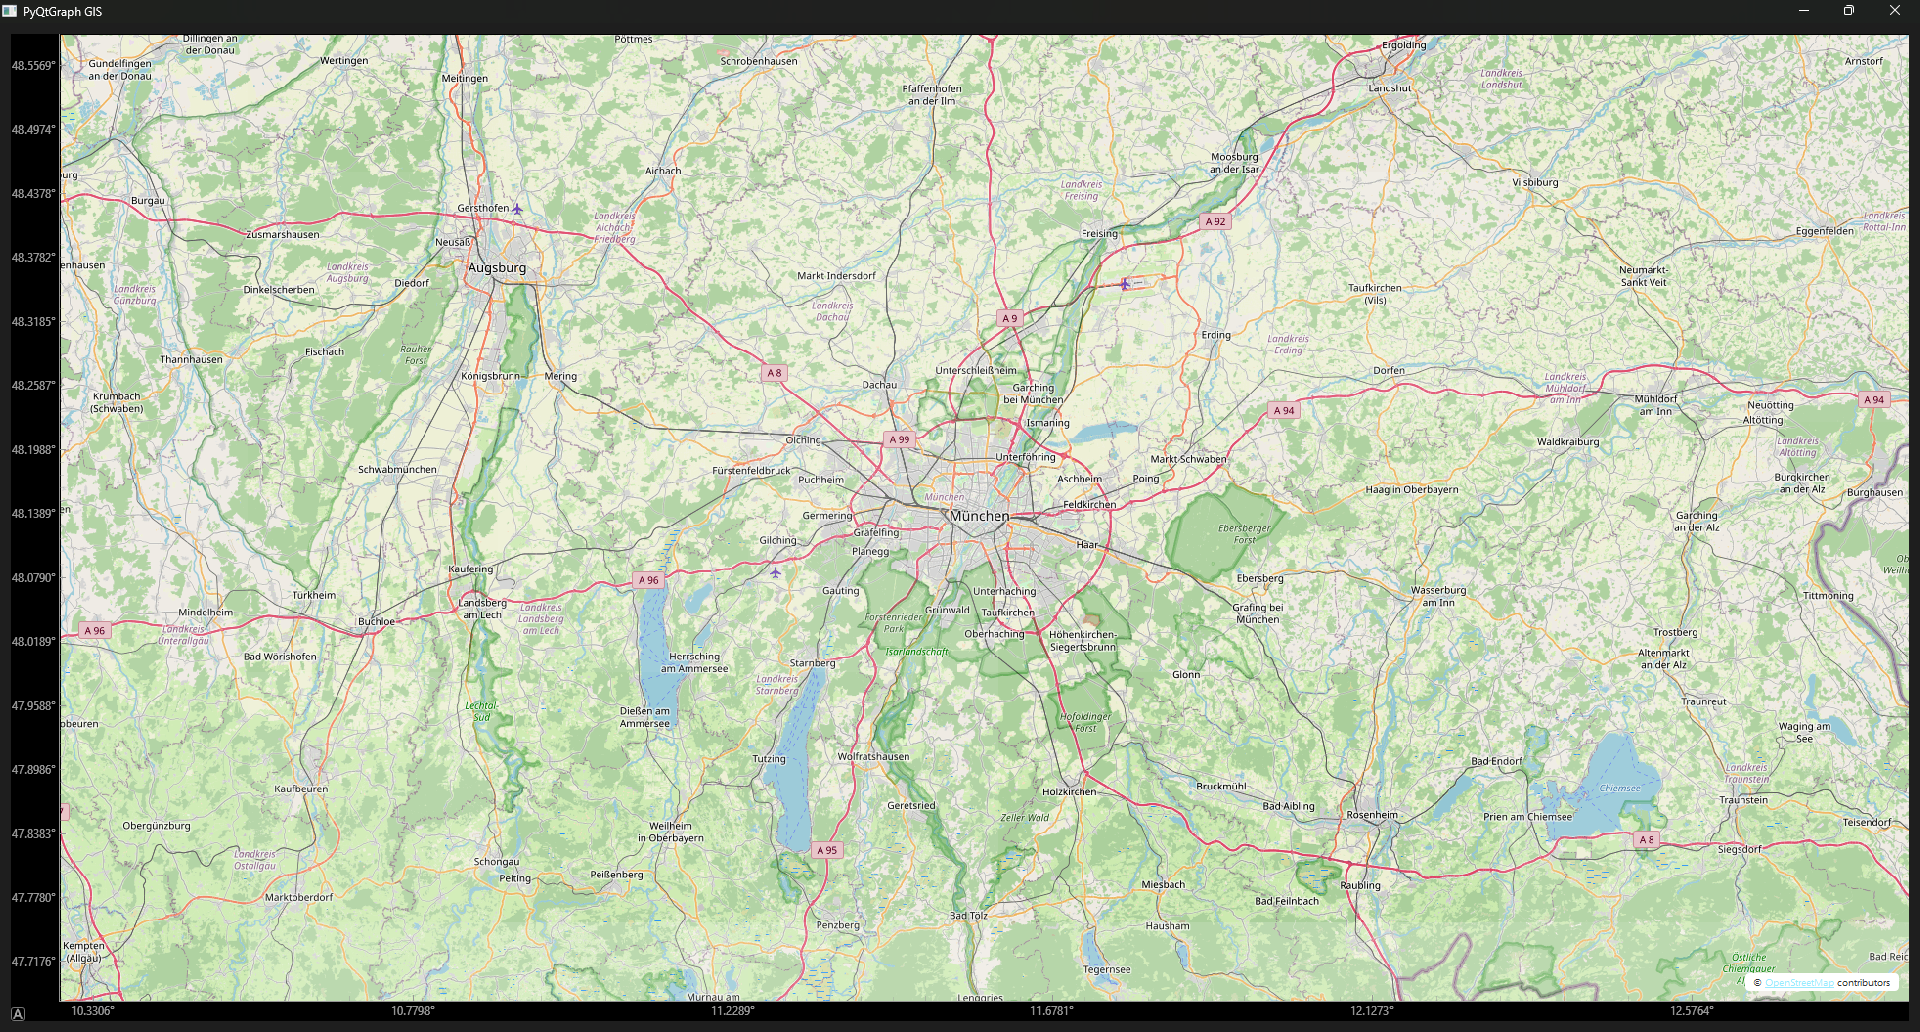
w.setWindowTitle("PyQtGraph GIS")
layout = QtWidgets.QGridLayout()
w.setLayout(layout)
# Initialize the map with OSM tiles and proper attribution
widget = MapWidget(
"https://tile.openstreetmap.org/{z}/{x}/{y}.png",
headers=headers,
attribution_text='© <a href="https://openstreetmap.org/copyright">OpenStreetMap</a> contributors'
)
# Add a marker (e.g., North Cape)
# Coordinates are [Latitude], [Longitude]
north_cape = widget.scatter([71.1725], [25.784444], symbol="o", size=10, brush="r")
layout.addWidget(widget, 0, 0)
w.show()
app.exec()